Query plan insights
All plans whose execution time exceeds the value specified in the "auto_explain.log_min_duration" parameter will be logged on the server.
Many query plans differ only in numerical indicators, such as column values, node execution time, and resource usage. These plans have the same execution tree structure and can be combined into a single template.
You can also sort columns to identify the most frequently used templates and the templates that use the most resources.

Heavy queries
Queries that send a lot of traffic over the network, both outbound (too long query which is automatically generated or a set of parameters) and inbound (large data sets with query results), can also cause significant issues for the server. By analyzing the traffic consumption throughout the day and how the execution time of a particular plan differs from the time the result was delivered to the client application, you can understand if these queries overlap so significantly as to cause issues for the database management system server.

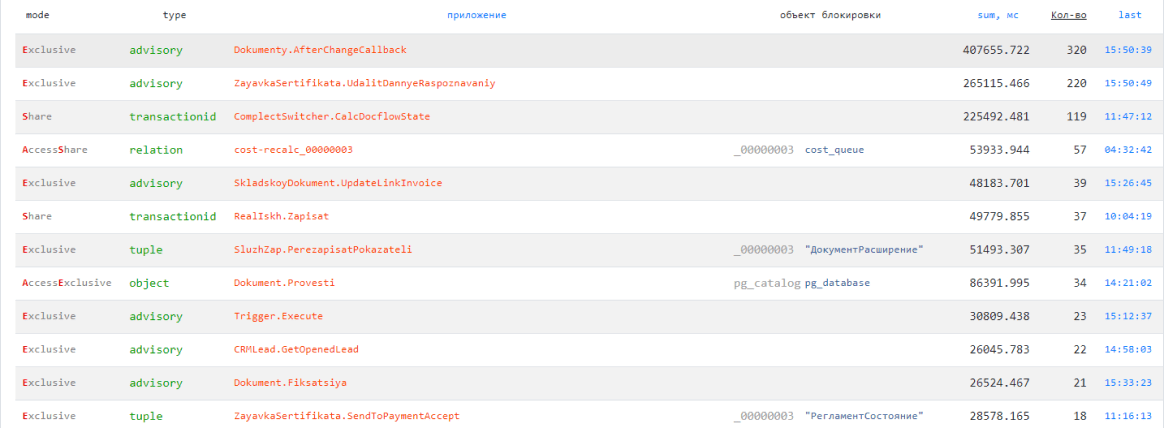
Query blocks
Real-time monitoring allows you to get an instant overview of active processes and view blocks on the PostgreSQL server as soon as this information appears in the log file. Up-to-date information about the interdependencies between different blocks helps identify and fix the root causes of problems after they occur by examining them in terms of both the applications and the objects causing conflicts.

Errors
All error messages that occur on PostgreSQL servers are grouped by type, allowing you to quickly analyze the occurrence of similar events throughout the day and view the specific arguments that triggered each error.

Pricing plans
Explain Multi
Query plan visualization and analysis, database server log analysis, comprehensive database assessment
- Support for text and JSON plan formats
- Work with compatible database plans (TimescaleDB, Greenplum, Citus, Amazon Redshift)
- Intelligent performance improvement suggestions
- Automatic recommendations for relevant indexes
- Detection of excessive data selection
- Relationship and data flow diagrams
- Associated query profiling
- Shared and personal plan archives
- Online server monitoring (locks, active queries, OS resources)
- Query clustering and heatmaps
