
Visualization of query plans
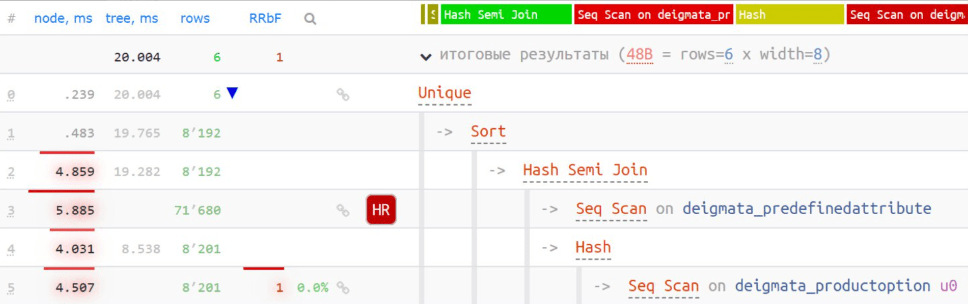
A simplified visualization of the plan tree allows users to see the full algorithm of the query processing. All numerical indicators are displayed separately and highlighted with color-coded labels based on the load.
The navigation panel shows the most time-consuming nodes and enables quick navigation to them.
Plan analysis
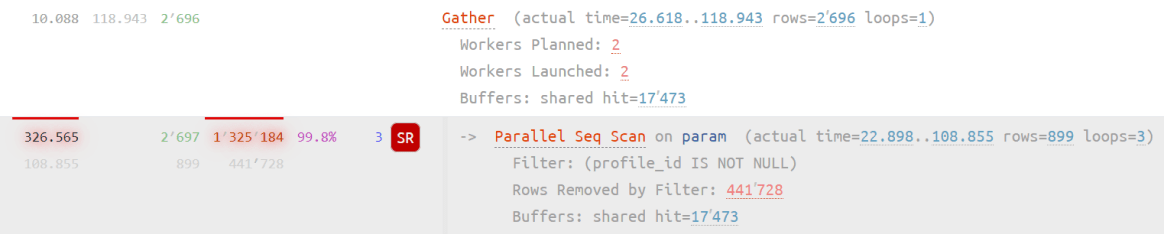
Анализ параллельных узлов суммирует, а не усредняет время выполнения с учетом распределения по всем задействованным ядрам CPU для выявления точек дальнейшей оптимизации нагрузки на сервер в целом.
Data-driven hints
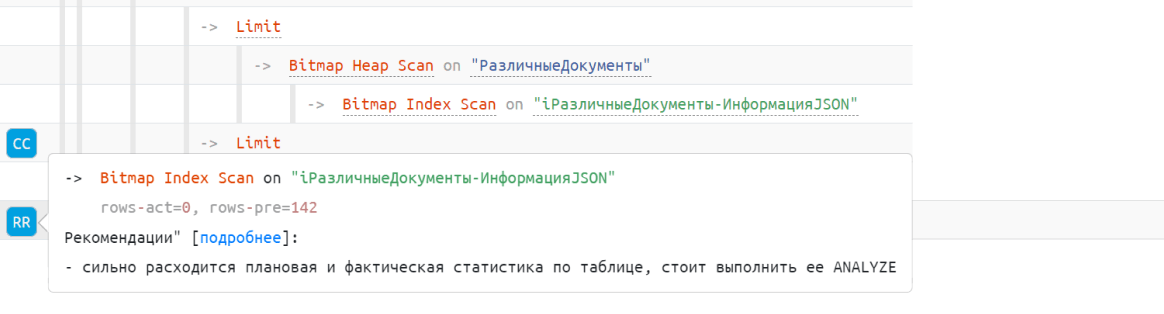
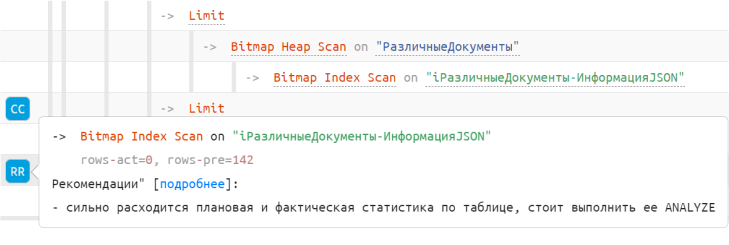
Интеллектуальные рекомендации, автоматически генерируемые на основе анализа структуры и ресурсных показателей плана, подскажут вам, в чем именно заключается проблема производительности запроса и как ее можно легко устранить.
Advanced features
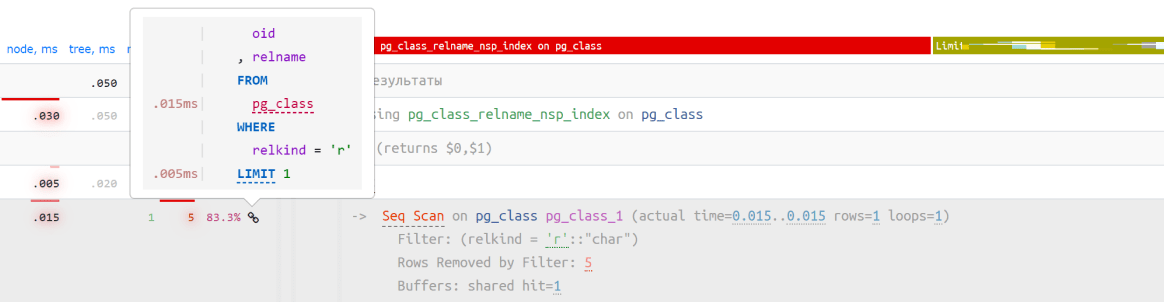
Отметка соответствующего узлу проблемного участка запроса помогает одним кликом перейти к соответствующей точке в запросе и обратно к плану, даже если они занимают по несколько экранов.
All plan formats
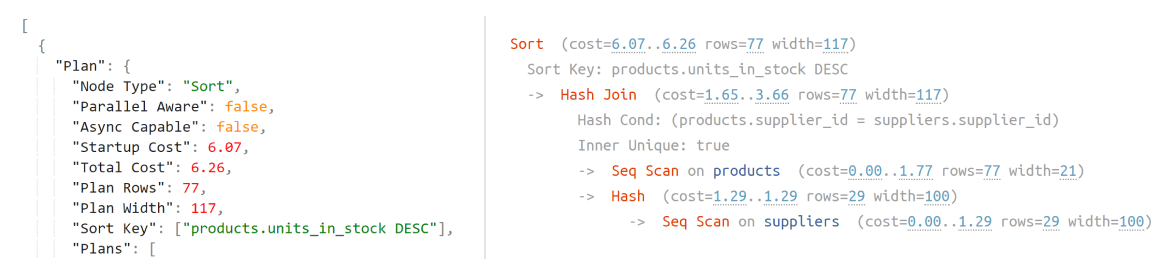
Different formats of query execution plans will be analyzed regardless of how they are obtained. The data for processing can be extracted from the console with line wrapping that depends on the screen width, formatted along with the query as a JSON log file, exported as a CSV file that includes enclosing quotes copied from pgAdmin, or presented without these quotes in JSON or standard text formats.
Various versions supported
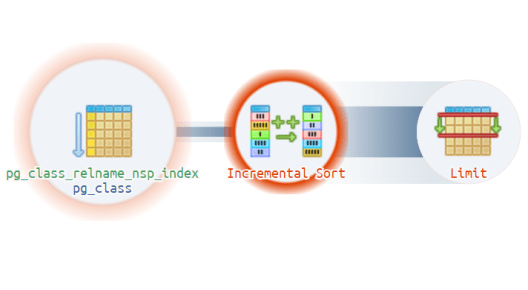
Recent versions of PostgreSQL generate plans with new node types such as Incremental Sort, Result Cache, Async Foreign Scan, and Index Skip Scan, which shouldn't cause any issues during query analysis.
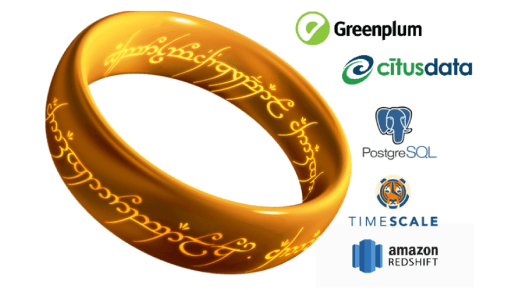
With enterprise forks supported , users can visualize their query plan using any of the specialized enterprise solutions, including Greenplum, Citus, TimescaleDB, and Amazon RedShift, in addition to standard PostgreSQL.
External API
Use our service's API to automate the export of query plans from your systems for visualization and analysis.

Pricing plans
- Support for text and JSON plan formats
- Work with compatible database plans (TimescaleDB, Greenplum, Citus, Amazon Redshift)
- Intelligent performance improvement suggestions
- Automatic recommendations for relevant indexes
- Relationship and data flow diagrams
- Associated query profiling
- Shared and personal plan archives